
Page Content
- Introduction
- The structure of an HTML report definition
- The “baseGroup” attribute
- Add/Change columns
- Add a Gantt chart
- The <filter> tag
- The <sort> tag
- The <reportview> tag
- The <option> tag
- Using layout items on HTML reports
- Advanced features
Introduction
In the following it’s described how to configure HTML reports, like adding/removing columns, changing the width of a column creating new reports and more. Also the structure of a report definition and the various tags and attributes are described.
Location of the XML configuration files
The definition of an HTML report is defined in a configuration file. The definition format follows an XML syntax which will be covered in this chapter.
Template configuration files are located in directory <sch_client_dir>\config. The configuration file for an English-language locale is called htmlreports.xml. Note that a report file exists for each supported language locale, thus the file for the Danish locale is called htmlreports_da_DK.xml.
To customize a report copy the htmlreports.xml (or the one which corresponds to the locale settings of ROB-EX) into directory <sch_client_dir>\custom. The reason to copy the file to the custom folder is that each time ROB-EX is updated to a newer version, the files in the config folder are replaced. Files in the custom folder will not be updated by the ROB-EX Scheduler installer.
Edit the report file with a text editor like notepad.exe or the like. It’s preferred to use an editor which can format XML correctly (e.g. Notepad++).
A simple HTML report definition
The XML below shows the definition of a basic HTLM report.
<htmlreport label="Gantt Job List" styleSheet="ganttChart.css" date="'<div class=date>'d-M-yyyy'</div>'" id="ganttJoblist">
<reporttable baseGroup="resource" view="ganttTable" cssClass="mainTable" hideEmptyTables="true">
<show property="name" showAs="headline" label="" />
<show property="operationlist.ProductionOrder.Name" showAs="default" label="Order name" cssClass="veryWideColumn" />
</reporttable>
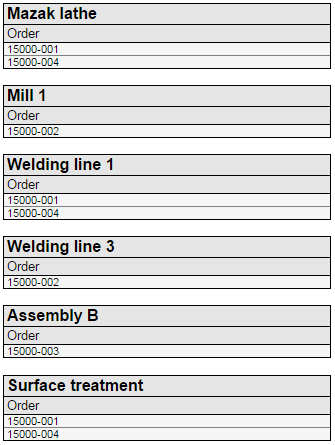
</htmlreport>When generating a report based on this definition, the report will show one table per resource. Each table contains the order name of operations assigned to the resource. The screen shot below shows the generated report. A screenshot from ROB-EX is shown next to the report, in order to illustrate the ROB-EX data the report is based on.
Example output
| The generated HTML report | The plan it is based upon |
 |
 |
The structure of an HTML report definition
As illustrated in the above listed report definition, each report is contained by an <htmlreport> tag. The sub tag <reporttable> represents a table in the report. Multiple tables can be defined in one report.
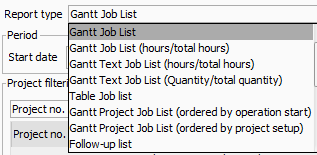
The “label” attribute (=“Gantt Job List”) of the <htmlreport> tag defines the name of the report as it will appear in the drop down list inside the “Print HTML” window. The reportview tag may be used to further tune, in what print situation a report is included. (i.e. printing from the Order List window will only include order overview related reports).
Basegroup
The base group of a report specifies the source table of the report. The base group is specified in the <reporttable> tag for each report. Example:
<reporttable baseGroup="resource" ....>By default, one table is created for each row of the base group. As an example when baseGroup="resource", then 10 resources in a ROB-EX plan will result in a report with 10 tables.
The most commonly used baseGroup values are: resource, project or productionorder
Data entities
Each base group returns a list of data entities. E.g. base group resource returns Resource data entities.
Data entity property fields
On each data entity, e.g. “operationlist.productionOrder” there’s a number of property fields, which represents the actual data fields. This could for instance be “operationlist.productionOrder.name” which would fetch the name of the production order. A complete reference of the properties can be found at The complete list of properties.
All references to ROB-EX data fields, must be relative to the base group. As an example if the base group of a report is “resource” and the “production order name” is to be fetched specify:
<show property="operationlist.productionOrder.name" showAs="default" label="Order name" cssClass="veryWideColumn" />I.e. first get the operation with operationList. Then get the Production Order entity with productionOrder and finally get the name. Each time you jump to a new entity. enter a period .
Another example. To fetch the “project name” specify
<show property="operationlist.productionOrder.project.name" showAs="default" label="Project name" cssClass="veryWideColumn" />Base group to data object navigation
The following diagram shows how to navigate from a base groups to one of the data entities:
| To data | Resource | Project | ProductionOrder | Operation | Material | MaterialAccess | MaterialTransaction |
|---|---|---|---|---|---|---|---|
| Basegroup | |||||||
| resource | operationlist .productionorder .project |
operationlist .productionorder |
operationlist | n/a | n/a | n/a | |
| project | operationlist.resource | operationlist .productionorder |
operationlist | n/a | n/a | n/a | |
| productionOrder | firstoperation.resource or operationlist.resource |
project | firstoperation or operationlist |
n/a | n/a | n/a | |
| operation | resource | productionorder .project |
productionorder | rawMaterialAccessList. rawMaterial |
rawMaterialAccessList | n/a | |
| materialManager | n/a | n/a | n/a | n/a | materialList | accessList | n/a |
| material | n/a | n/a | n/a | n/a | n/a | transactionList |
Add columns
Each column is represented by a <show> tag. To add a new column, simply copy a <show> line. Preferably copy a line resembling the one to be added.
In the following example three columns are to be added: The operation name, the operation start date and the operation end date.
The HTML report definition with three additional columns
<htmlreport label="Gantt Job List" styleSheet="ganttChart.css" date="'<div class=date>'d-M-yyyy'</div>'" id="ganttJoblist">
<reporttable baseGroup="resource" view="ganttTable" cssClass="mainTable" hideEmptyTables="true">
<show property="name" showAs="headline" label="" />
<show property="operationlist.ProductionOrder.Name" showAs="default" label="Order name" cssClass="veryWideColumn"/>
<show property="operationlist.Name" showAs="default" label="Operation name" cssClass="veryWideColumn" />
<show property="operationlist.startCalendar.customDate.dd-MM-yyyy HH:mm" showAs="default" label="Start" cssClass="veryWideColumn" />
<show property="operationlist.endCalendar.customDate.dd-MM-yyyy HH:mm" showAs="default" label="End" cssClass="veryWideColumn" />
</reporttable>
</htmlreport>The HTML report with three additional columns
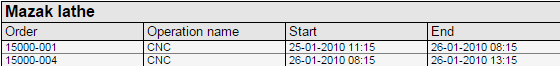
Change the width or appearence of a column
The “cssClass” attribute on the <show> tag refers to a CSS class and therefore decides the appearance of the column. In the above HTML report the columns “Start” and “End” are a little bit too wide. In order to change the width another CSS class must be selected or the selected CSS class must be altered. Some predefined CSS classes exists with various widths.
Refer to Customize CSS classes for a list of predefined CSS classes.
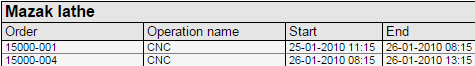
If the “cssClass” attribute of the “Start” and “End” column is changed to “mediumWideColumn”:
<show property="operationlist.startCalendar.customDate.dd-MM-yyyy HH:mm" showAs="default" label="Start" cssClass="mediumWideColumn" />
<show property="operationlist.endCalendar.customDate.dd-MM-yyyy HH:mm" showAs="default" label="End" cssClass="mediumWideColumn" />
…the report will look as follows.
Add a Gantt chart
The following line will add a Gantt chart on the right side of the generated HTML tables.
<show property="operationlist.ganttChart.{ganttColouring},{showProgress}.'week 'w" showAs="ganttChartDayformatted" label="'<nobr>'d-MMM'<br>'E'</nobr>'" />The “ganttChart” property is only available on the operationlist property. The “operationlist” property is available on the “Resource”, “Project and “ProductionOrder” basegroup objects. For more info about properties and basegroups see The “baseGroup” attribute.
The HTML report with a Gantt chart added
The <filter> tag
Data in a report can be filtered by using the <filter> tag.
Ex. 1: The following filter will only let orders with status greater than 15 (forecasted) be viewed.
<filter property="operationlist.productionorder.status" source="value" value="15" compare="<" />See Order status overview for an overview of the order states.
Ex. 2: The following filter will filter away operations that have been completed, only operations with state less than 70 (complete) are shown
<filter property="operationlist.statusLevel" source="value" value="70" compare=">" />See Order status overview for an overview of the order states.
Multiple filters can be added to a report and only data which all filters evaluates to true is shown. As an example the filters below will only let orders with status greater than 15 and priority less than 3 be viewed.
<filter property="operationlist.productionorder.status" source="value" value="15" compare="<" />
<filter property="operationlist.productionorder.priority" source="value" value="3" compare=">" />Below the filter tags are shown in context in the HTML report definition example:
<htmlreport label="Gantt Job List" styleSheet="ganttChart.css" date="'<div class=date>'d-M-yyyy'</div>'" id="ganttJoblist">
<reporttable baseGroup="resource" view="ganttTable" cssClass="mainTable" hideEmptyTables="true">
<filter property="operationlist.productionorder.status" source="value" value="15" compare="<" />
<filter property="operationlist.productionorder.priority" source="value" value="3" compare=">" />
<show property="name" showAs="headline" label=""/>
<show property="operationlist.ProductionOrder.Name" showAs="default" label="Order name" cssClass="veryWideColumn"/>
<show property="operationlist.Name" showAs="default" label="Operation name" cssClass="veryWideColumn"/>
<show property="operationlist.startCalendar.customDate.dd-MM-yyyy HH:mm" showAs="default" label="Start" cssClass="mediumWideColumn"/>
<show property="operationlist.endCalendar.customDate.dd-MM-yyyy HH:mm" showAs="default" label="End" cssClass="mediumWideColumn"/>
<show property="operationlist.ganttChart.{ganttColouring},{showProgress}.'week 'w" showAs="ganttChartDayformatted" label="'<nobr>'d-MMM'<br>'E'</nobr>'"/>
</reporttable>
</htmlreport>The attributes in the <filter> tag
property: The data field to filter on.
value: The value to filter against.
compare: How “value” should relate to the data.
Supported values in the “compare” attribute:
Remember to encode the ‘<’ sign and the ‘>’ sign (see the “Encoded value” column below). This must be done because the less than and greater than signs are reserved characters in XML.
| Compare value | Encoded value | Description |
|---|---|---|
| < | < |
reads “property less than value” |
| <= | <== |
reads “property less than or equal to value” |
| > | > |
reads “property greater than value” |
| >= | >== |
reads “property greater than value” |
| != | reads “not equal to” / “different from” | |
| = == |
both reads “equal” (no difference) |
Filter on selected start and end date
The selected dates on the “File->Print html report” dialog is passed to the report by specifying the filters
<filter value="{endTime}" property="operationlist.FirstPossibleStartCalendar.purecustomdate." compare=">==" />
<filter value="{startTime}" property="operationlist.EndCalendar.purecustomdate." compare="<==" />The <sort> tag
Reports can be sorted in ascending or descending order on a specified property data field.
Sorting on the basegroup
The example below will sort the report on resource name (the basegroup is set to “resource”).
<sort property="name" order="ascending" />The above <sort> tag decides the order of the tables. since typically you will have a table for each basegroup object. I.e. if the basegroup is resource, you will have a table for each resource.
In the example above, a property data field is specified directly on the basegroup without a “list” in between, e.g. “operationlist”. As a result of this the order of the resource tables in the Example_output would instead be:
- Assembly B
- Mazak lathe
- Surface treatment
- Welding line 1
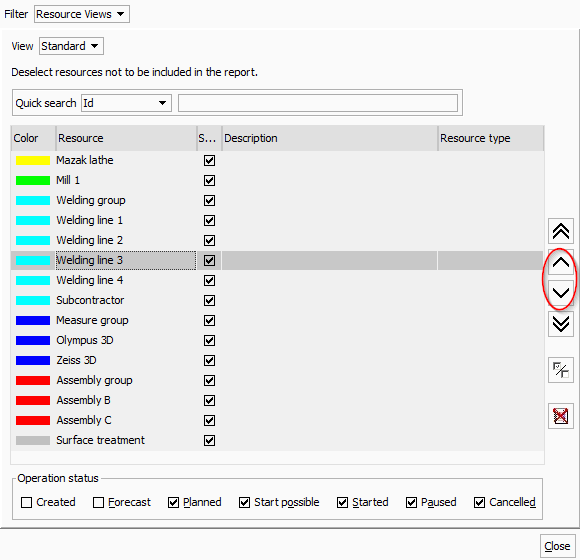
The user generating the report may use the function “More filters” located in menu “File->Print html report”. In here it is possible to change the order of the resources to be printed.
In order to allow this user override, then always first use a sort line with this special syntax.
<sort property="IdInListSort.{idList}" order="ascending" />Sorting within table content
Multiple <sort> tags can be added. The very first <sort> tag will be the way the basegroup object is sorted. The next sort lines will typically decide the sorting within each table. By adding the line below, the contents of the tables is, in this case, sorted by operation start time.
<sort property="operationlist.StartCalendar.TimeInMillis" order="ascending" />Multiple <sort> tags can be added. The two lines below will first sort the contents in the tables by operation start time. And then by the operation name. So if two or more rows have the same start time they are sorted by operation name as well.
<sort property="operationlist.StartCalendar.TimeInMillis" order="ascending" />
<sort  property="operationlist.name" order="ascending"  />
Sorting on calendar columns
Calendar (time) based fields has some special notations useful for sorting purposes. I.e. in the following example the TimeInMillis notation is used
<sort property="operationlist.StartCalendar.TimeInMillis" order="ascending" />The synatx and meaning of the available options are
- TimeInMillis
- The date of the field represented in milliseconds. This is good for sorting precisely by the the date and time of the calendar.
- TimeInDays
- The date of the field represented in milliseconds, but rounded to the day at 00:00 midnight. This is useful to collect all operations scheduled for the same day of the week – and then use additional sort criteria’s to decide the internal sorting within the day of week. I.e. secondly sorting on the project number, then you would get a list of all operations planned for a certain day of week – with operations for same project listed after each other.
A full <sort> example
Below the above described <sort> tags are shown in context in the HTML report definition example:
<htmlreport label="Gantt Job List" styleSheet="ganttChart.css" date="'<div class=date>'d-M-yyyy'</div>'" id="ganttJoblist">
<reporttable baseGroup="resource" view="ganttTable" cssClass="mainTable" hideEmptyTables="true">
<filterproperty="operationlist.productionorder.status" source="value" value="15" compare="<"/>
<filterproperty="operationlist.productionorder.priority" source="value" value="3" compare=">"/>
<sort property="IdInListSort.{idList}" order="ascending" />
<sort property="name" order="ascending" />
<sort property="operationlist.StartCalendar.TimeInMillis" order="ascending" />
<sort property="operationlist.name" order="ascending" />
<show property="name" showAs="headline" label=""/>
<show property="operationlist.ProductionOrder.Name" showAs="default" label="Order name" cssClass="veryWideColumn"/>
<show property="operationlist.Name" showAs="default" label="Operation name" cssClass="veryWideColumn"/>
<show property="operationlist.startCalendar.customDate.dd-MM-yyyy HH:mm" showAs="default" label="Start" cssClass="mediumWideColumn"/>
<show property="operationlist.endCalendar.customDate.dd-MM-yyyy HH:mm" showAs="default" label="End" cssClass="mediumWideColumn"/>
<show property="operationlist.ganttChart.{ganttColouring},{showProgress}.'week 'w" showAs="ganttChartDayformatted" label="'<nobr>'d-MMM'<br>'E'</nobr>'"/>
</reporttable>
</htmlreport>The <reportview> tag
This tag decides in which window in ROB-EX Scheduler client, the report will be accessible. The example below will make the report appear in the “File->Print html report” dialog.
<reportView name="default" show="true" />Below the possible values are listed and to which window the context belongs to. From each mentioned window it is possible to print one or more reports.
Possible values in the “name” attribute:
| Value in “name” attribute | The window in ROB-EX |
|---|---|
| default | File->Print html report |
| economy | Edit->Economy |
| productionOrderList | Edit->Order list |
| operationManagement | Edit->Operations |
The <option> tag
Options may be given to the reports below the <htmlreport> tag. Option tags act as settings or input to the generation of the content. The tag has the following attributes:
- name
- value
- enabled
Listed here are some of the options available:
| Name | Value | Enabled | Description |
|---|---|---|---|
| respectTimeInterval | true/false | If report generation should regard or disregard the time stamps for start and provided in the “Print HTML” dialog. |
Example of the option tag usage:
<htmlreport label="Gantt Text Job List (Quantity/total quantity)" id="textQuantityJoblist">
  <option name="color" value="resource" />
  <option name="respectTimeInterval" enabled="true" />
Add a report
The most convenient way to create a report is to copy an existing. Simply copy everything between the begin-end <htmlreport> tags, the tags included.
Please notice that the “id” attribute of the <htmlreport> tag must be unique, so this must be changed to a non existing value! It’s also advised to change the “label” attribute of the <htmlreport> tag because this is the way the reports are distinguished in Rob-ex.
Using layout items on HTML reports
A column/field/variable in the tables in ROB-EX is handled by a so called “LayoutItem”. Those layout items can also be used on reports. In the following example the “Workload (Common)” layout item is added to the order list and then it’s added to the HTML report “Order status”. The “Order status” report can be printed from the order list, by selecting the “Print” button. The “Workload (Common)” layout item will show the sum of the workload on the operations, on an order and the total sum on a project.
Columns on some of the tables in ROB-EX can be added/removed by using the Field chooser. Right click on the table header and select “Field chooser”, see below.
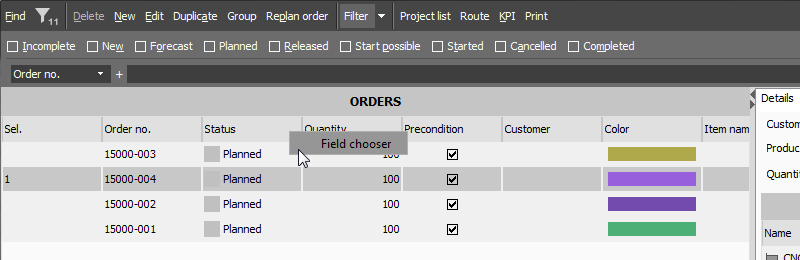
In the field chooser the “Workload (Common)” column (or layout item) is added to the order list.

By adding the line below to the “Order status” report, the layout item “Workload (Common)” is added”. The id of the layout item is “common_workload”, which is the one to reference a layout item by. See Variable List for a complete list of layout items.
<show property="LayoutItem.common_workload.#.#" showAs="default" label="Workload sum" />The “Workload (Common)” layout item is added to the “Order status” report, showing the sum of the workload from the operations in the order.

Customized layout items can be added from a user plug-in which can also be used on reports.
Specify a multiplier on layout item values
On layout items returning a number it’s possible to specify a multiple which the result should be multiplied with. This is useful when converting from i.e. hours to minutes.
Consider the example below:
<show property="operationlist.LayoutItem.common_baseline_diff.#.#.Multiplier=60" showAs="default" label="Baseline" cssClass="smallColumn" />Just insert the “Multiplier” part after the decimal format (the hash sign) – marked in yellow in the above example.
Property layout items
Many objects has a property field, which is a dictionary of keys and value pairs. The various property layout items can be used in reports to view the value of a single key, in the same manner they are used in the tables. For instance to view the value for the key “key” for operation objects the layout item operationproperty can be used along with the name of the key:
<show property="operationlist.LayoutItem.operationproperty.key" />A dot and the name of the key is appended after the layout item.
Advanced features
Custom sum row
It’s possible to add a custom sum under each Gantt chart table. The field from which the sum is calculated from is specified by a so called Layout item. All the fields in the field chooser is represented by a Layout item.
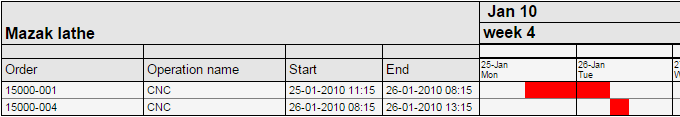
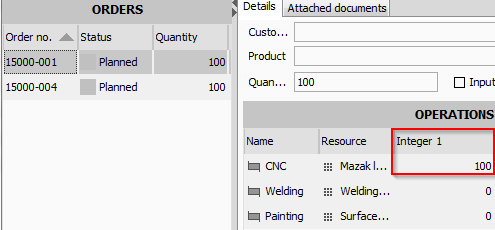
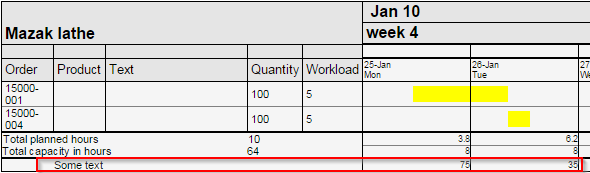
In the example report shown below the “custom int 1” field on Operation is used.
On the order “15000-001” there’s entered a value of 100 in the “Integer 1” field on it’s CNC operation. On the other order, “15000-004”, the operation’s field value is set to 10.
Below the operation in order “15000-001” is spanning over multiple days. In this case the value displayed will be relative to the workload percentage of each day.
For instance the displayed value on January the 25th is 75. The explanation is: The total workload of the operation is 5 and the workload on January the 25th is 3.8, the relationship is 3.8/5. And multiplied by the “Integer 1” value of 100: (3.8/5) * 100 = 75. The values are rounded to whole integers, so a possible remaining value will be added to the value on the last day. If there’re overlapping operations in the Gantt chart the value from each operation will be summed in the overlapping period, as seen on January the 26th, where the rest of 25 from the order “15000-001” is added to the 10 from “15000-004”.
How to add a custom sum row
Find the show property tag like the one shown below. This is the one who will cause the Gantt chart to be generated.
<show property="operationlist.ganttChart.{ganttColouring},{showProgress}.'week 'w"
showAs="ganttChartSum.{addToSum}"label="'<nobr>'d-MMM'<br>'E'</nobr>'"/>Add the attribute shown below:
customParameters="Sum{LayoutItem.opr_custom_int1, label=Some text}"This will result in:
<show property="operationlist.ganttChart.{ganttColouring},{showProgress}.'week 'w" showAs="ganttChartSum.{addToSum}" customParameters="Sum{LayoutItem.opr_custom_int1, label=Some text}" label="'<nobr>'d-MMM'<br>'E'</nobr>'"/>Notice that this will only work with the showAs attribute “ganttChartSum” and “ganttChartText”.
Horizontal sum column
It’s possible to add a Horizontal sum column which adds together the sum of the workload or quantity per resource in the selected period.

In the example report shown above the Horizontal sum column has been added after the workload.
How to add a horizontal sum column
Add the property as shown below:
<show property="resourceLIst.sum.HorizotalSum.#.#" showAs="default" label="'Horizontal sum" cssClass="'wideColumn"/>It will show the sum of the workload or quantity per resource in the selected period.
It works for all “Gantt chart reports” where the basegroup is “Resource” and where the “{addToSum}” parameter is specified on the showAs for the ganttChart property.
Generate consuming/producing sum for specific warehouse
Below tag will generate the consuming sum of all materials:
<show cssClass="wideColumn" label="Consumption" property="materialList.ConsumingSum.#.#"/>We can change this to generate the consuming sum of all materials but only for a specific warehouse. This is done with the below tag:
<show cssClass="wideColumn" label="Consumption" property="materialList.ConsumingSum.{Warehouse1}.#.#"/>This will limit the sum to materials consumed from warehouse1.
Auto refresh
The “autoRefresh” attribute can be used for automatically reloading the HTML report in a specified time interval. This is handy if the html file is located on a shared network drive and is updated regularly.
How to insert the autoRefresh attribute
Find the “htmlreport” property and insert the “autoRefresh” attribute as shown below. The “htmlreport” tag is the top level tag in each report. In the example shown below the refresh rate is set to 30 seconds.
<htmlreport label="Gantt Job List" styleSheet="ganttChart.css"
date="'<div class=date>'d-M-yyyy'</div>'"
autoRefresh="30" id="ganttJoblist" >Disable utilization row
The utilization row which is showed below the resource tables in among other Gantt Job list (hours/total hours) reports can be disabled in the folowing way.
Insert this tag in the GanttChart property line: customParameters=“showUtilizationRow=false”
A full example:
<show property="operationlist.ganttChart.{ganttColouring},{showProgress}.'uge 'w" showAs="ganttChartQuantityText.{addToSum}" label="'<nobr>'dd/MM'<br>'E'</nobr>'" customParameters="showUtilizationRow=false" />Specify other step than workload on Gantt chart
On the right side of the HTML table a Gantt chart is shown (for instance on the “Gantt job list” report). This will draw bars from operation start to end. However it is possible to specify that for instance only the setup time part should be painted. Below line will add the Gantt chart to a report where it shows setup time only.
It is the {visualizeStep=SETUP} part which is relevant here.
<show property="operationlist.ganttChart.{ganttColouring},{showProgress}.'week 'w.{visualizeStep=SETUP}" showAs="ganttChartDayformatted" label="'<nobr>'d-MMM'<br>'E'</nobr>'" />Possible values are (not case sensitive):
- SETUP
- FILLUP (only available with Batch module)
- WORKLOAD
- EMPTYING (only available with Batch module)
- SWITCHOVER
- MAX_STORAGE (only available with Batch module)
Post your comment on this topic.