
The ROB-EX Dashboard App will present KPIs of the current schedule to a broader audience than the normal ROB-EX Scheduler planner, viewer or operator. Anyone interested in the overall performance, health and capacity of the production may be interested in the ROB-EX Dashboard App.
Key features
- ROB-EX KPI data easily accessible on mobile devices
- Provide other roles in the company with relevant targeted information – including management level
- Default selection of KPIs. Available out-of-the-box from ROB-EX Scheduler 6.4 and forward
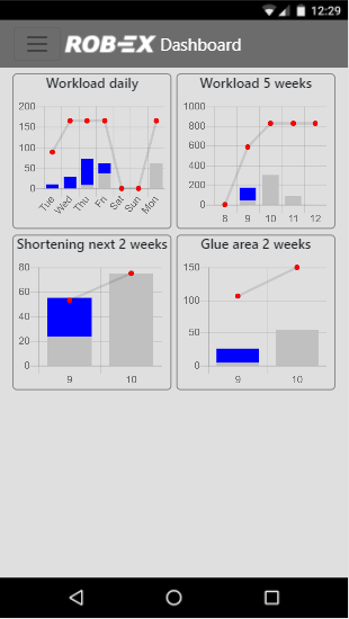
- Standard graphical workload graphs, showing available vs. scheduled workloads for any combination of resources.
- Standard historical graphical workload graphs, showing available vs. actual workloads for any combination of resources. From ROB-EX Scheduler v7.0 and newer
- View-only Gantt charts. User defined horizons and coloring. From ROB-EX Scheduler v7.0 and newer
- The app is available at no extra cost and with unlimited no. of clients.
- A Web App which can be opened from a web browser (not available in App Store or Google Play)
- Works on all platforms with modern HTML5 browsers – including mobile platforms
- Best deployed using ROB-EX Integration Client in a Multiuser environment. However, for lighter deployments including demo, the Dashboard web-server may run from any ROB-EX Scheduler Client.
- Authentication and authorization supported for both active directory and native ROB-EX Scheduler users
- We will continue to develop and enhance the Dashboard App based on the feedback we receive.
Post your comment on this topic.