
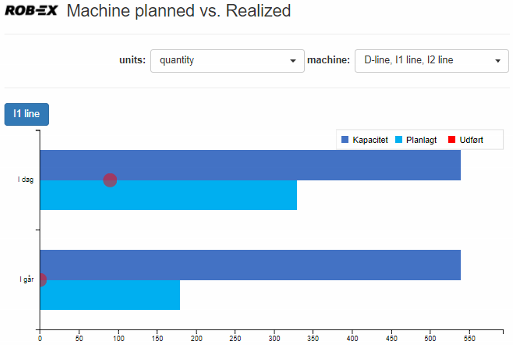
This is a web-based App to display KPI’s for a resource (machine). The KPI’s shown are
- available hours (open shift calendar time)
- scheduled hours
- actual production in hours or quantity.
These figures are displayed as a graph for “Today” and “Yesterday”. Multiple graphs, one per resource, may be displayed. The graphs has been designed to scale nicely to both Desktop Browser and Mobile browsers.
The KPI’s answers the following basic operator biased questions
- How many hours must my machine run today
- Is my machine scheduled to run with full capacity – or do I have time to carry out e.g. preventive maintenance
- Is my machine currently on track regarding today’s scheduled work
- How did my machine perform yesterday
Note that planned and actual hours/quantity is without setup time (this to ensure that users can seamlessly change between hours and quantity).
Post your comment on this topic.