
 |
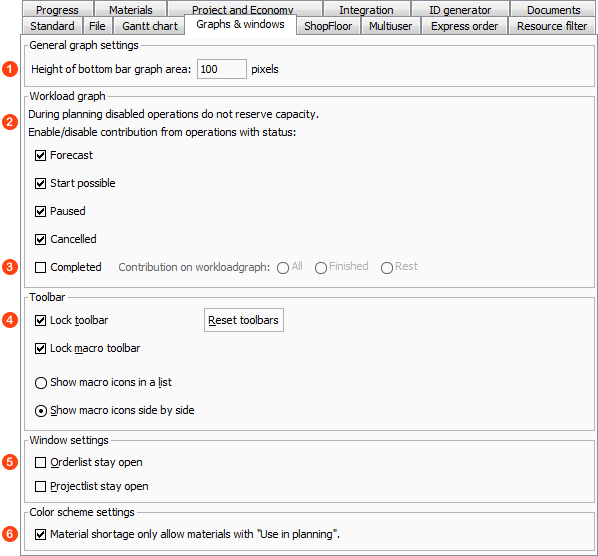
The max height in pixels of the bottom area of the gantt chart showing graphs for workload, man-power and material. Note that this is the max height, since ROB-EX will only use up the space necessary to show currently viewed graphs. |
 |
Workload graph settings deciding what operation states is to be included in the workload graph. A normal setting may be to disable contributions from operations with state complete, since they no longer take up capacity. The following examples shows an operation with status complete and how the workload graph is affected by turning the “Show completed” flag respectively on  and off and off  |
 |
When completed operations contributes on the workload graph, it can be selected which part of the workload that contributes on the workload graph.
|
 |
The toolbar can be locked below the menus or be able to undocked and floating. The same goes for the macro toolbar part. The macro toolbar can be a drop-down-list or icons side-by-side. |
 |
The order list can stay open when pressing “Find” and “Highlight” buttons. The project list can stay open when pressing the “Show” button. |
 |
Material shortage color scheme setting allowing the color scheme to only account for materials that have the “Use in planning” setting selected. |
Post your comment on this topic.