
Note that this tab is only available with license to the BOM module.
 |
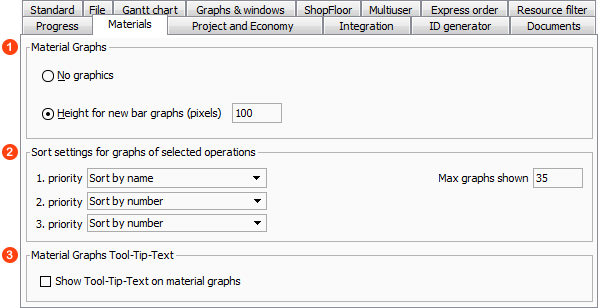
If “No graphics” is selected then material graphs will show values but without bar graphics. If enabling graphics specify the height in pixels for each material graph shown. A normal value will be between 30-50 pixels. The lower the height the more graphs can be shown in the same space. The total amount of space reserved for all graphs (including e.g. workload and manpower graphs) can be specified in the Graphs tab. |
 |
The sort settings are relevant to functionality available in the menu item “View->Show materials for selected operation”, deciding the sort order of materials shown when the user selects one or more operations that either consumes or produces materials. If needed you may sort 3 times with the priorities as shown. After the first priority sorting, anything that was deemed to be “equal” based on the sorting criteria selected, will then be sorted again based on the second priority etc. Should the sorting result in a pop-up box allowing you to cancel the sorting it is because the graphs take a long time to be displayed with the new sorting. You may cancel if wished or continue to load the graphs with the new sorting. Max graphs shown indicates the sum of materials shown when you select the Show materials for selected operations option. Please note however that if you choose a high number it may cause instability in the plan – so please consider carefully before changing it from default. |
 |
Check this to enable Tool-tip-text on the material graphs. |
Post your comment on this topic.