
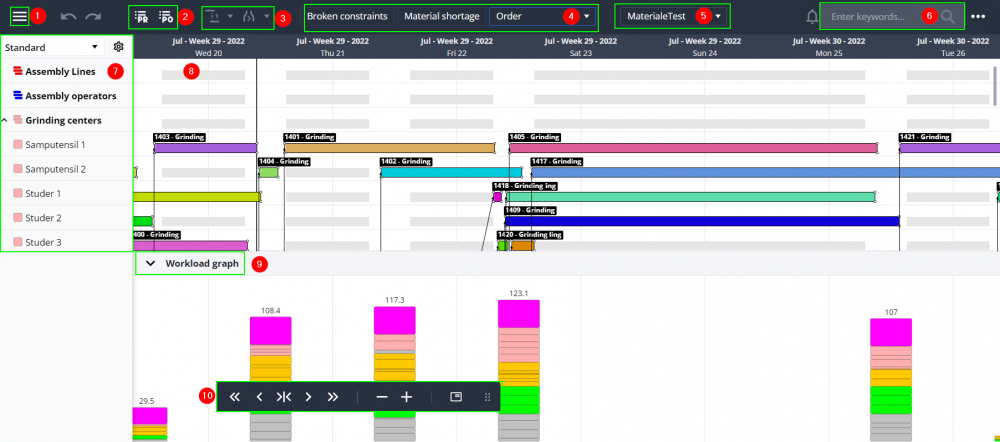
This section provides an overview of ROB-EX Web Planner. The main view of the Gantt chart is shown below.
 Home menu
The home menu contains two buttons. The first button for Portal will lead you to the portal site with an overview of all the sites that you have access to. The second is for the admin page, see more about the admin page. Note for both links you might be asked to provide your login credentials.

 Order list and project list
The button  opens the project list and the
 ![]() button opens the order list. See more about the Order list and the Project list
button opens the order list. See more about the Order list and the Project list
 Planning strategi and bottleneck sort
The button ![]() is for the planning strategy and the button
is for the planning strategy and the button ![]() is for bottleneck sort. See more about Planning strategy and Bottleneck sort
is for bottleneck sort. See more about Planning strategy and Bottleneck sort
 Operations color
Click on the dropdown to choose which color the Gantt operations should show. See more about the coloring in the section View menu under the Coloring. On the left side of the dropdown, the two operations colors that are often used in your plan are shown.

 Macro
Macro
 Search field
Start typing the order number and a dropdown with matching orders will show up under the search field. In the dropdown on the right side of the borderline there’s an eye icon, click on that to show the order in the Gantt chart. The next button will open the order list and highlight til order in the order list.

 Resource list
The list of the resources in the plan. See more about Resource
 The Gant chart
In the middle of everything the Gantt chart allows manual drag/drop scheduling as well as fast and easy activation of the automatic scheduling rules including bottlenec scheduling.
 Workload graph
The workload graph show the hourly, daily, weekly or monthly hours spend across all visible resources. Read more about the Workload graph
 Navigation bar
The navigation bar for zooming and moving around in the Gantt chart. See more about Navbar

Post your comment on this topic.