
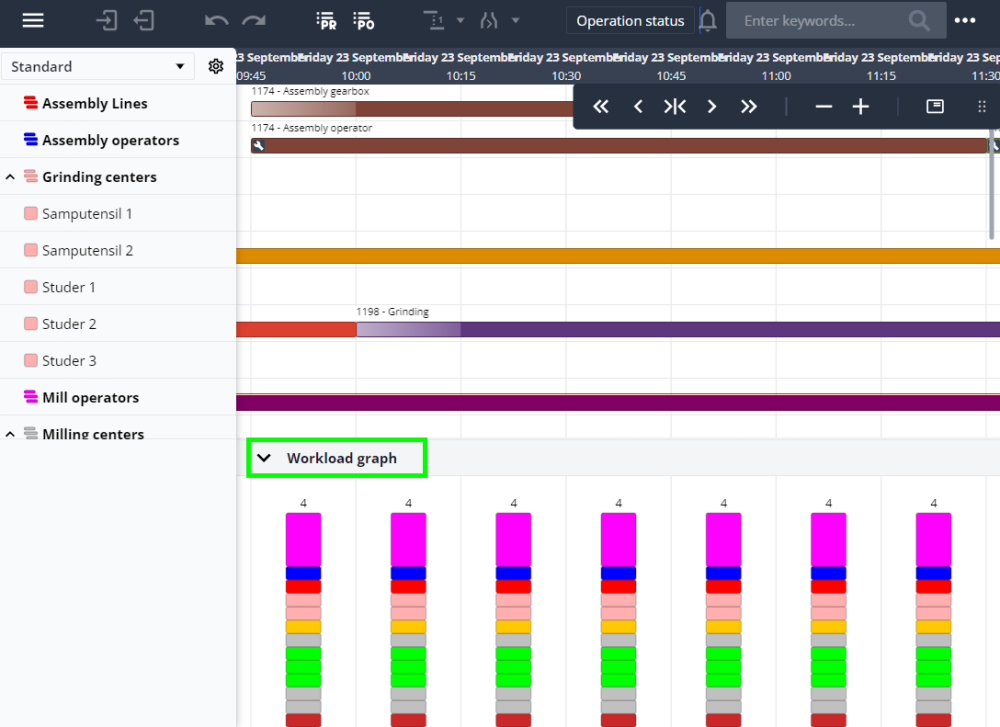
A workload graph is by default shown at the bottom of the Gantt chart. To hide or show the graph use the arrow next to the Workload graph titlle. The workload relating to each resource is shown by the color assigned to the resource in the resource list. See more about the workload graph at The graph area
Post your comment on this topic.